Are AI Sports Predictions Accurate? The Full Validation Behind a 79% Win Rate
The short answer: across historical backtests of high-confidence Expert-tier games, the Mysports.AI BERT v4.8 model reaches a 79% win rate, and following its picks at a flat stake produced +1,240 units of net profit last season at roughly 24% average ROI. This page lays out exactly how those numbers are defined, how the model works, where its limits are, and how we validate it — losing games included.
An Honest Definition of the 79% Win Rate: It Does Not Mean Every Bet Wins 79% of the Time
Let us be upfront — this is the single most important part of the report. Too many services throw out one pretty number and never explain where it comes from.
79% Is What You Get After the AI Filters the Slate
Hundreds of games run every day, and the model does not recommend all of them — it surfaces only the handful of high-confidence games it is most sure about. The 79% is the historical hit rate on those selected games: it never bets every game, but when the AI does step in, the odds of winning sit close to four in five. The flip side: if you pick games at random and expect 79%, that is not what the model promises.
+1,240 Units Is About Long-Term Compounding, Not a Single Game
Stake a flat 1 unit per bet (say $100) and follow the model over the long run, and last season produced +1,240 units of net profit across all leagues. There were losing days and losing weeks along the way — the equity curve is built up over time, not off one miracle game.
13,000+ Games Monitored Live, 53 Model Iterations
The database spans the brand-new 2025-26 season, feeding every line move across NBA, MLB and NHL into the computation. The algorithm went from v1.0 to v4.8 over 53 major upgrades, each adding new features (such as player circadian rhythm and money flow) so the model keeps evolving in step with the market.
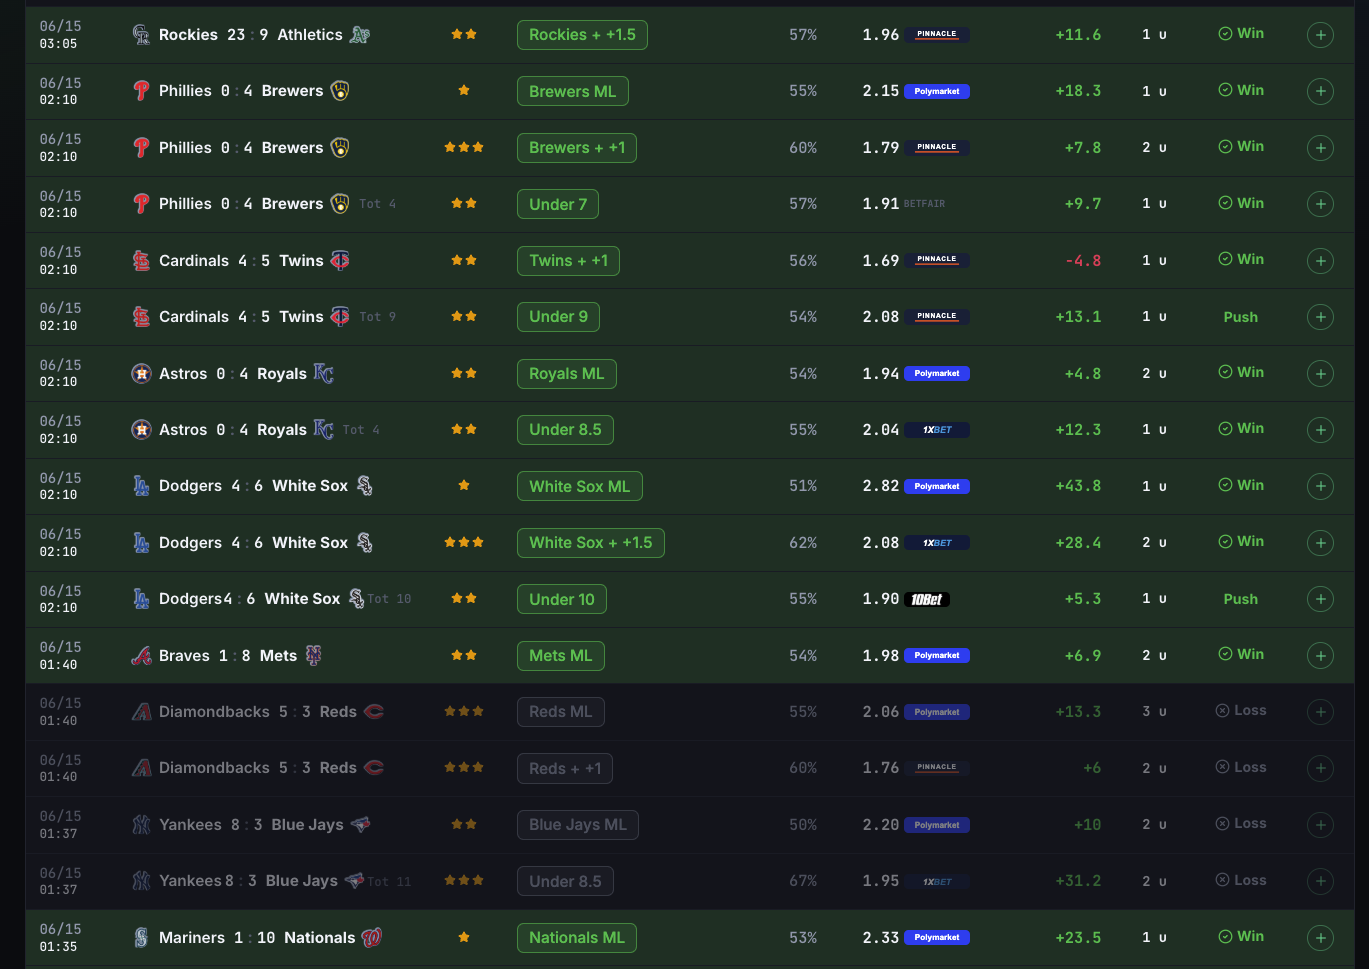
Real Prediction Screens: Daily Picks and Past Results, Game by Game
These are not mockups — they are the actual screens from the Mysports.AI prediction page. Every game shows its confidence score, best available market odds and expected value (EV); past predictions are labeled game by game as Win / Loss / Push, with the hit rate updating live — wins and losses on the same table.
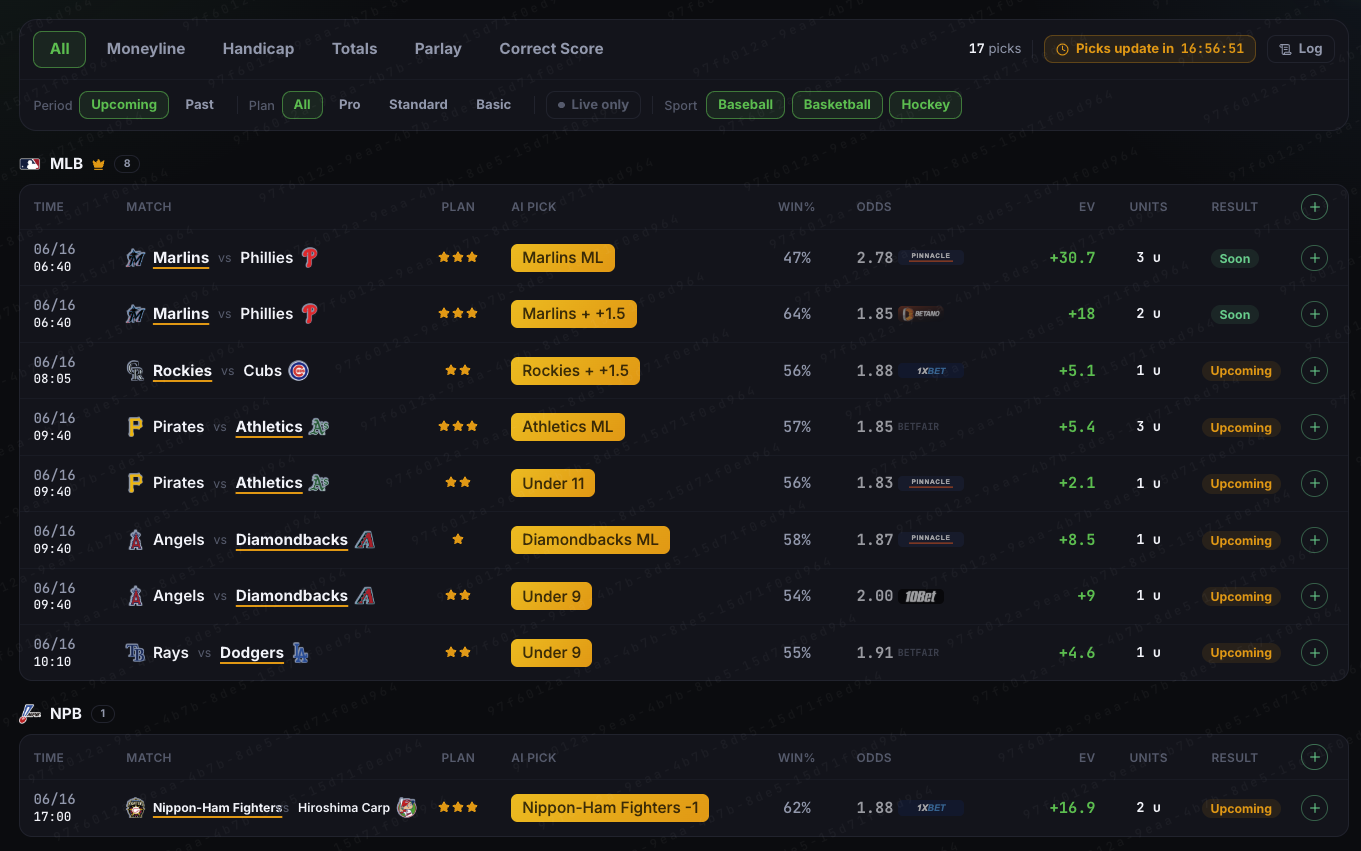
*The overall hit rate shown under “Past predictions” is around 50% (covering every market and confidence level); the 79% headlined on this page is the hit rate after narrowing down to Expert three-star high-confidence games — fewer bets, more selective, but more accurate. The two figures do not contradict each other; they are simply “all picks” versus “after filtering.”
Model Validation Curves: Three Charts That Prove It Really Wins
Talk is cheap, so these three charts each answer one question — does it make money (equity curve), is it accurate (calibration curve), and is it just memorizing (learning curve). Scroll down and the curves draw in real time. All are backtest illustrations and not a guarantee of future results.
Equity Curve · +1,240 units cumulative
Net profit from following picks at a flat stake; drawdowns along the way, built up over time.
Calibration Curve · confidence vs actual win rate
The closer the green line hugs the grey ideal, the more trustworthy the confidence score (yellow dot = 79%).
Learning Curve · training vs validation accuracy
When the two lines converge, the model is not just memorizing data and can generalize to new games.
Why a BERT Model? Three Edges Traditional Models Cannot Match
BERT (Bidirectional Encoder Representations from Transformers) was originally built by Google to understand human language, but its ability to handle time-series data far exceeds traditional sports models like LSTM. For the full algorithm design, see our AI algorithm breakdown.
Edge 1: Contextual Data Correlation
Traditional models read data in one direction only (projecting the future from the past), so a star injury simply pulls the win rate down. BERT cross-references “a key player out” against “line movement” at the same time: when a star is sidelined yet the bookmaker oddly fails to move the price much, the model flags it as a possible trap line and recommends the opposite side. That grasp of context is exactly the blind spot of linear models.
Edge 2: Self-Attention That Reweights on the Fly
More data does not equal more accuracy — what matters is weighting. The self-attention mechanism mimics a human expert’s intuition, automatically judging which signal matters most in each game: in the NHL the model assigns goaltender form (GSAx) a very high weight and dials down home-court advantage; in the NBA attention shifts to player fatigue and three-point shooting trends. It is not a rigid formula — it switches mindsets by league.
Edge 3: 1,500+ Features That Turn “Luck” Into Explainable Variables
Think of driving: the 300-feature v4.2 is a paper map — it points the way but cannot react to the unexpected; the 1,500-feature v4.8 is live navigation, watching traffic jams (money flow), speed cameras (bookmaker trap lines) and a crash ahead (player injuries) all at once. In MLB it even folds in catcher pitch-framing skill and home-plate umpire strike-zone consistency — the kind of details that routinely decide pitchers’ duels by 1–2 runs. The finer the information, the bigger the edge, and that is why v4.8 carries a win rate 13 percentage points higher than v4.2.
BERT v4.8 Self-Attention Heatmap: Feature Weights Across Leagues
Each number is the relative attention weight the model assigns (0–100; higher is redder). Only the four major leagues NBA, MLB, NHL and NFL are shown here; every other league has its own full weight distribution.
| Feature | NBA | MLB | NHL | NFL |
|---|---|---|---|---|
Key Player Status Key Personnel | 95 | 95 | 92 | 96 |
Schedule Fatigue Fatigue / B2B | 88 | 45 | 65 | 60 |
Environment & Weather Environment | 5 | 82 | 10 | 94 |
Market Money Flow Money Flow | 75 | 60 | 55 | 85 |
Recent Team Form Momentum | 60 | 30 | 50 | 70 |
Home Advantage Home Advantage | 85 | 40 | 65 | 80 |
Referee Tendencies Ref / Umpire | 70 | 90 | 30 | 60 |
Advanced Efficiency Advanced Metrics | 92 | 95 | 96 | 98 |
Three-Tier Compute Architecture, Backtested: Starter v4.2 → Standard v4.5 → Expert v4.8
Beyond win rate, look at max drawdown and the profit/loss ratio: the smaller the drawdown and the smoother the curve, the easier a losing streak is to ride out; a 3.50 profit/loss ratio means that for every 1 unit lost, the long-run average returns 3.5 units of profit.
| Key metric | Starter v4.2 | Standard v4.5 | Expert v4.8 |
|---|---|---|---|
| Model win rate | 66.2% | 76.5% | 79.2% |
| Feature count | 300+ / game | 1,200+ / game | 1,500+ / game |
| Leagues covered | 10+ major leagues | 25+ leagues | 25+ leagues |
| Bet types | Moneyline | All markets | All markets |
| Return on investment (ROI) | 8.5% | 15.2% | 24.5% |
| Max drawdown | -18.5% | -10.2% | -4.8% |
| Average odds | 1.65 | 1.85 | 1.92 |
| Profit/loss ratio | 1.25 | 1.88 | 3.50 |
Starter v4.2 focuses on gauging strength across the 10 major leagues; Standard v4.5 unlocks every market and excels in regional leagues where lines adjust more slowly; Expert v4.8 fuses four winning factors — circadian-rhythm tracking, ballpark micro-climate, global money flow and scenario simulation — and is the only version that breaks the 55% ceiling in high-variance, low-scoring sports like MLB and the NHL.
By League — Hit Rate Across Confidence Thresholds, Laid Bare
Moneyline hit rate from the BERT v4.8 backtest (2022–2025), layered by confidence threshold and split by league. Higher confidence means fewer qualified games but higher accuracy. Weak markets are shown as-is (e.g. Serie A dips at ≥70%), with no after-the-fact removals — that is what verifiable means.
| League | ≥50% | ≥55% | ≥60% | ≥65% | ≥70% |
|---|---|---|---|---|---|
| NBA | 67.5% | 69.9% | 72.5% | 75.5% | 79.1% |
| MLB | 57.0% | 59.8% | 64.5% | 70.4% | 73.7% |
| NHL | 61.3% | 63.7% | 67.5% | 71.4% | 74.7% |
| Premier League | 66.1% | 69.5% | 73.7% | 76.4% | 80.7% |
| La Liga | 67.0% | 70.8% | 77.2% | 81.1% | 83.9% |
| Serie A | 63.8% | 66.9% | 70.4% | 76.5% | 72.7% |
| Bundesliga | 64.9% | 68.2% | 71.5% | 75.8% | 76.9% |
| Ligue 1 | 65.1% | 69.4% | 71.4% | 74.9% | 76.4% |
| MLS | 59.3% | 65.0% | 68.0% | 76.1% | 85.7% |
| Overall | 61.3% | 64.5% | 69.0% | 73.9% | 77.6% |
* Figures = moneyline hit rate for each league at that confidence threshold (2022–2025 walk-forward backtest), consistent with the full downloadable report below.
Model Limits and Risk Disclosure: AI Is Not 100% Accurate
The Statistical Limits of Historical Data
Each figure on this page has its own scope: the 79% win rate and +1,240 units come from backtests and live play of the latest model (v4.8) on high-confidence games; the 13,000+ games refer to live monitoring of the 2025-26 season; and the downloadable full moneyline record covers 2022-2024. Past performance does not guarantee future results — games carry inherent, unpredictable randomness (in-game injuries, refereeing errors and the like), so predictions are a decision-support tool only and should never be treated as a guarantee of profit.
Even a High Win-Rate Model Has Losing Streaks
Yes — any probability-based model runs into short-term swings, and 79% is no exception. What the data does tell you is that the higher the win rate, the lower the odds and depth of a losing streak (v4.8’s max drawdown of -4.8% is far better than v4.2’s -18.5%). Manage your bankroll, and do not let a few extreme events create the kind of psychological pressure that makes you abandon the strategy — only long-term consistency lets compounding show.
Bankroll Management and the Nature of This Service
We recommend managing your bankroll with the Kelly Criterion or flat staking (try it with our betting calculators) and betting only with disposable income. This service provides sports data analysis only — it offers no betting service of any kind and neither accepts nor places bets on your behalf; the legal and financial risks of betting on third-party platforms rest entirely with the user. For more detail, see our FAQ.
Verify It Yourself: We Publish Every Record, Losing Games Included
Most sites only dare claim their wins and quietly hide the losses. We lay out the full moneyline prediction record of more than 20,000 games from 2022–2024 — every win and every loss is in there (the actual look of the record is shown below). For the latest daily past predictions and results, go straight to the Mysports.AI prediction page and review them game by game; the complete backtest report (BERT v4.8 · 2022–2025) is available to download below. Only by facing the data honestly can you earn real trust.
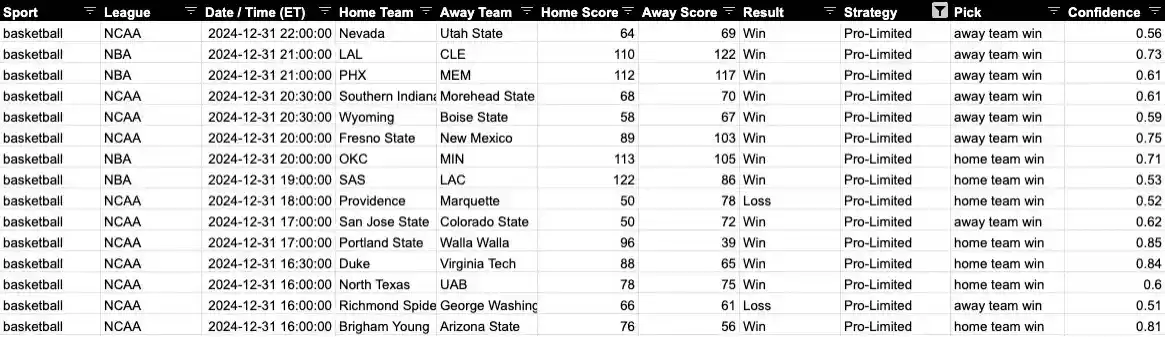
Historical Record Field Reference
- League — The competition (e.g. NBA, MLB, EPL)
- Date / Time (ET) — Game date and time in US Eastern Time (not local time)
- Home / Away Team — Home and away teams
- Home / Away Score — Final score for both teams
- Pick — AI selection: the specific bet the system recommended
- Result — Prediction outcome: the game graded as a Win or a Loss
- Strategy — Strategy model tied to the subscription tier (e.g. Pro Expert)
- Confidence — Raw AI confidence score; the higher the value, the higher the win rate
How to verify: sample any 30 games and cross-check them against public results sites, then log your own follow-along results in Mysports.AI and let your own equity curve validate the model — more reliable than any marketing pitch.
Backtest Hit Rate by Confidence Threshold (2022–2025)
BERT v4.8 · across NBA/MLB/NHL plus six soccer leagues + MLS · figures taken straight from the downloadable file below.
| Confidence | Hit rate | Sample |
|---|---|---|
| ≥50% | 61.3% | 26,516 |
| ≥55% | 64.5% | 19,346 |
| ≥60% | 69.0% | 12,174 |
| ≥65% | 73.9% | 7,305 |
| ≥70% | 77.6% | 4,208 |
*Hit rate = correct predictions ÷ qualified games at that threshold (overall moneyline). Peak single-league high-confidence ≈ 79% (NBA ≥70%: 1,702/2,151). Higher confidence means fewer qualified games but higher accuracy — a normal calibration trade-off.
BERT v4.8 · 2022–2025 · NBA/MLB/NHL plus six major soccer leagues + MLS: hit rate by confidence threshold and full game-by-game detail to cross-check yourself.
Methodology and Sources: Standing on the Shoulders of Public Research
Our feature engineering and rating methods are built on publicly verifiable statistical research and data sources — feel free to check and cross-reference them yourself:
- Self-Attention Mechanism — Vaswani et al. (2017), Attention Is All You Need
- Elo Rating System — Arpad Elo (1978): dynamically adjusting strength by opponent quality
- Football Goal Modeling — Dixon & Coles (1997), Modelling Association Football Scores
- Poisson Distribution — The probabilistic foundation for modeling scoring / goal counts
- Player Efficiency Rating (PER) — The composite efficiency metric introduced by John Hollinger
- NBA Historical Data Sources — Basketball-Reference · stats.nba.com
Note: the above are the public research and data sources underpinning this model’s feature engineering and rating methods; the model architecture, weights and implementation are developed in-house by Mysports.AI.
The Data Is Ready — Now It’s Your Turn to Verify
Now that you see where the 79% comes from, the next step is building your own record: log every bet for free and let your equity curve tell you exactly how accurate the model is.